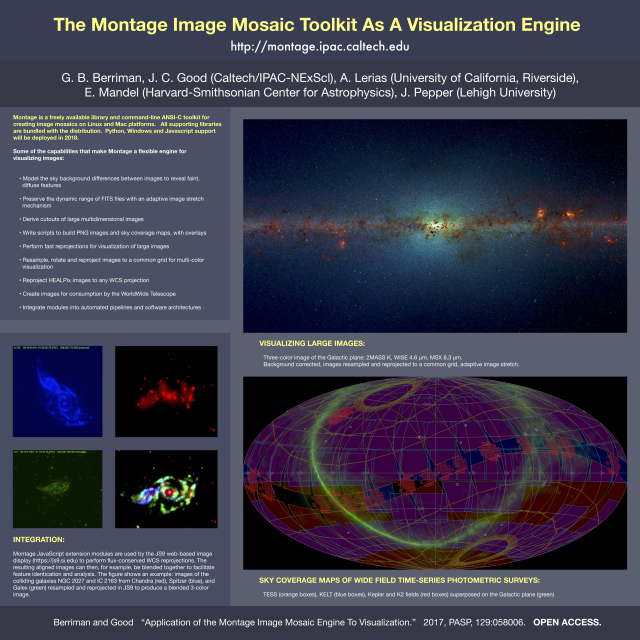
At the AAS Jamuary meeting, I presented a poster on how the Montage Image Mosaic Toolkit (http://montage.ipac.caltech.edu) is increasingly being used as a visualization engine. The poster was designed by Angela Lerias (U.California, Riverside), who is interning with the Montage project.It gives three examples of visualization:
Creating large multi-color images for visualization;
Sky-coverage maps of wide area time-series photometric surveys; and
Integration of Montage into the JS9 web based image display tool (http://js9.si.edu).
Those of you who have used Montage probably know it as a toolkit for processing images to create mosaics. It is, however, finding applicability in the visualization of images, as described in “The Application of Montage to the Visualization of Astronomical Images,” by Bruce Berriman and John Good. It is an Open Access paper published in a PASP Special Focus Edition on Visualization, edited by Brian Kent.
You can watch a video abstract of the paper here:
There are several areas where Montage brings value to visualization work, primarily because its design as a toolkit enables integration into software environments:
Integration into visualization environments, usually asa reprojection engine to co-register and re-project multi-wavelength images to a common set of image parameters, and represent them in a common coordinate system. Examples are JS9 and APLPy. Luciani et al 2014 integrated Montage into a highly-scalable client-server architecture intended as a…
Most of you are familiar with how to create image mosaics with Montage. You can also use the mViewer module to create sky coverage maps. The image below, from Rodriguez et al. (2017) shows an example of this, created to show how the KELT-N and KELT-S fields overlap with the Kepler and K2 fields.
The graphic can be created with a single call to mViewer:
mViewer itself is a command-line tool (though it can be used in interactive visualization scenarios through Python and web GUIs). It can easily be embedded in pipelines and in conjunction with other Montage modules can provide adaptive support for building visualizations for presentation and reporting. mViewer overlay “commands” are actually a set of (repeatable) command-line directives, as will be illustrated here. The complete set of directives can be found in the mViewer documentation.
One of the most interesting applications that I have found for Montage is by the Lincoln Near Earth Asteroid Research (LINEAR) program. A paper by Vighh et al. (2015) described how LINEAR has made significant contributions to the discovery of Near-Earth Objects (NEOs), thereby improving knowledge of the NEO size distribution and helping to characterize the threat to the Earth from NEOs. AS well as contributing over 1.3 million new observations of known local objects, the project discovered 483 new NEOs, broken down as follows:
The team has integrated Montage into its processing pipeline. The observing cadence involves 15 min revisits to each observing field, during which time the field rotation caused by the telescopes Alt-Az mount is sufficiently large that the same CCD chip images from the five collected frames do not line up in image coordinates. Thus they use Montage to rotate and co-register all the images, so that are ready for source detection. Their Figure 6, shown below, shows a registered rectangular frameset after processing by Montage, and their Figure 7 shows an example detection of a moving object.
See “Initial asteroid detection results using the Space Surveillance Telescope,” by Viggh, H.E.M, Ushomirsky, G. ; Stokes, G. ; Cornell, M. ; Ruprecht, J.D. ; Varey, J. ; Klein, A. ; Goldberg, M. 2015, http://ieeexplore.ieee.org/xpl/abstractAuthors.jsp?arnumber=7118951
This is a presentation given at the Special Session on Tools and Tips for Better Software, held at the 227th AAS Meeting, Kissimmee, FL, Jan 5, 2016. It was one of six presentations given at the session, whose purpose is described below.
“Research in astronomy is increasingly dependent on software methods and astronomers are increasingly called upon to write, collaborate on, release, and archive research quality software, but how can these be more easily accomplished? Building on comments and questions from previous AAS special sessions, this session, organized by the Astrophysics Source Code Library (ASCL) and the Moore-Sloan Data Science Environment at NYU, explores methods for improving software by using available tools and best practices to ease the burden and increase the reward of doing so. With version control software such as git and svn and companion online sites such as GitHub and Bitbucket, documentation generators such as Doxygen and Sphinx, and Travis CI, Intern, and Jenkins available to aid in testing software, it is now far easier to write, document and test code. Presentations cover best practices, tools, and tips for managing the life cycle of software, testing software and creating documentation, managing releases, and easing software production and sharing. After the presentations, the floor will be open for discussion and questions. “
We have released the Montage youTube channel at https://www.youtube.com/channel/UCFjmHCDrq4YIUly1r082TjA . We have posted four videos of image cubes created with Montage, and will be posting more in the coming months. Here is one example:
This is a full-resolution mosaic of the central 256 frequency planes of 30 GALFA-HI images, centered on 0h Right Ascension. The RGB color is derived by combining 3 adjacent frequency planes. All gaps, such as that around 20 degrees declination, are due to incomplete coverage in the input images.
Video created by Dr. B Rusholme. Mosaic derived on the Amazon EC2 cloud of Amazon Web Services, with an Education Credits Grant awarded through the “AWS SKA AstroCompute Program.”
The release supports aggregation of of data stored as data cubes (actually, multidimensional data sets with four dimensions) into mosaics, and a new command-line visualization tool. Details are a follows:
Five new modules dedicated to aggregating multidimensional input images in FITS format into mosaics of data cubes, and to supporting management and analysis of these cubes and their associated metadata. These modules are:
mTranspose: Re-orders axes of multi-dimensional data sets.
mProjectCube: Reprojects a single cube to the scale and coordinate system specified by the user; it supports all projections in the World Coordinate System (WCS) library; and it supports the “Drizzle” algorithm.
mSubCube: Creates a subimage (“cutout”) of a cube.
mShrinkCube: Reduces the size of a FITS cube according an input scaling factor.
mAddCube: Co-adds the reprojected cubes to form the output mosaic.
All but mTranspose are analogs of modules for creating two dimensional mosaics.
Backwards-compatible updates to existing modules to support processing of data cubes.
A new module, mViewer, supports rendering from the command line of multi-dimensional images as well as large-scale images. It creates JPEG and PNG output files. The JPEG files contain AVM tags, which support incorporation of the images into the WorldWide Telescope (WWT) and other E/PO tools.
A beta version of a Python wrapper around mViewer to support incorporation into Python processing environments.
As with earlier releases, the new release is written in ANSI-compliant C and intended for use on all common Unix-based platforms. It was tested formally on RedHat Enterprise Linux Server 5.9 and on Mac OS X 10.9.x, with the gnu cc complier version 4.1, and the primary test data sets were public data cubes measured with the OSIRIS integral field spectrograph at the Keck Observatory and cubes released by the Galactic Arecibo L-band Feed Array HI (GALFA-HI) Survey.
Sample image
This image represents an average of the central 10 velocity planes of a mosaic of five data cubes released as part of the Galactic Arecibo L-band Feed Array HI (GALFA-HI) survey (Peek et al., 2011, Ap J Suppl, 194, 20; DOI 10.1088/0067-0049/194/2/20; ADS Bibcode 2011ApJS..194…20P). GALFA is a high-resolution (~4′), large-area (13,000 deg2), high spectral resolution (0.18 km s-1), and wide band (-700 km s -1 < v LSR < +700 km s-1) survey of the Galactic interstellar medium in the 21 cm line hyperfine transition of neutral hydrogen conducted at Arecibo Observatory. See the Data Cube Mosaics tutorial on how to compute a data cube mosaic such as this.


